Double Bubble Chart
A double bubble chart can be used to examine the similarities and differences between two terms. In the example below, I've compared to words that are often used as synonyms, but that actually have separate definitions:
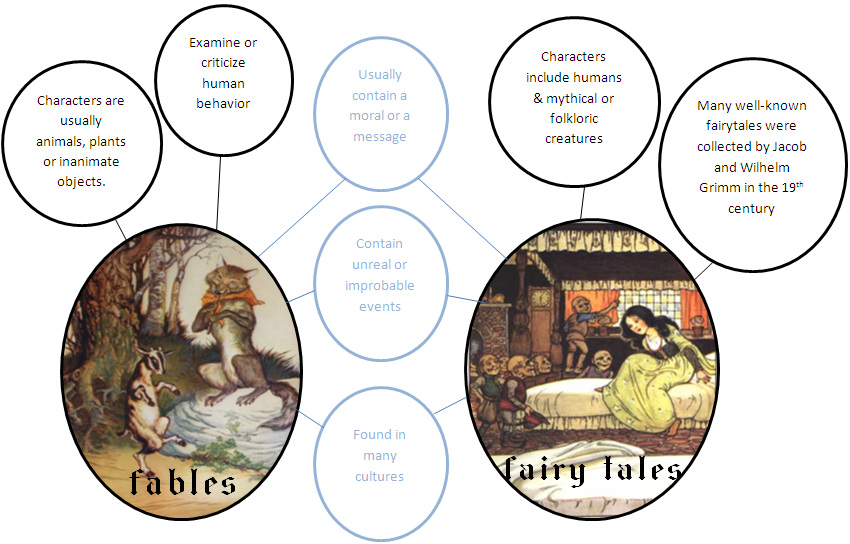
According to Richard and Jo Ann Vacca's Content Area Reading, graphic organizers, such as the one above, may be used "to activate students' prior knowledge of the vocabulary words in a text assignment or unit of study and [to] clarify their understanding of concepts as they study text" (Vacca, 2008, p. 156).
